An interactive, data-driven dashboard for SPIN scooter that is tailored to a tablet modality and empowers both gig workers and accessibility advocates to complete their jobs on the go.
How might we design a dashboard around e-scooter data to fulfill the goals of both gig workers and accessibility advocates?
Target Users
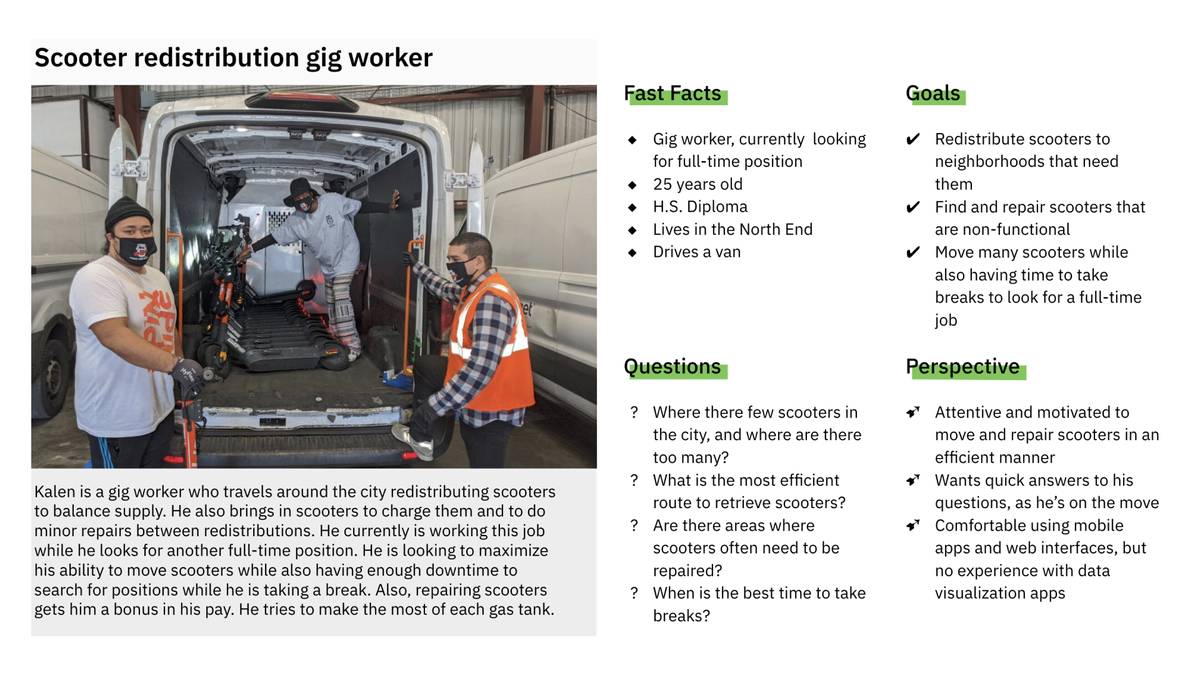
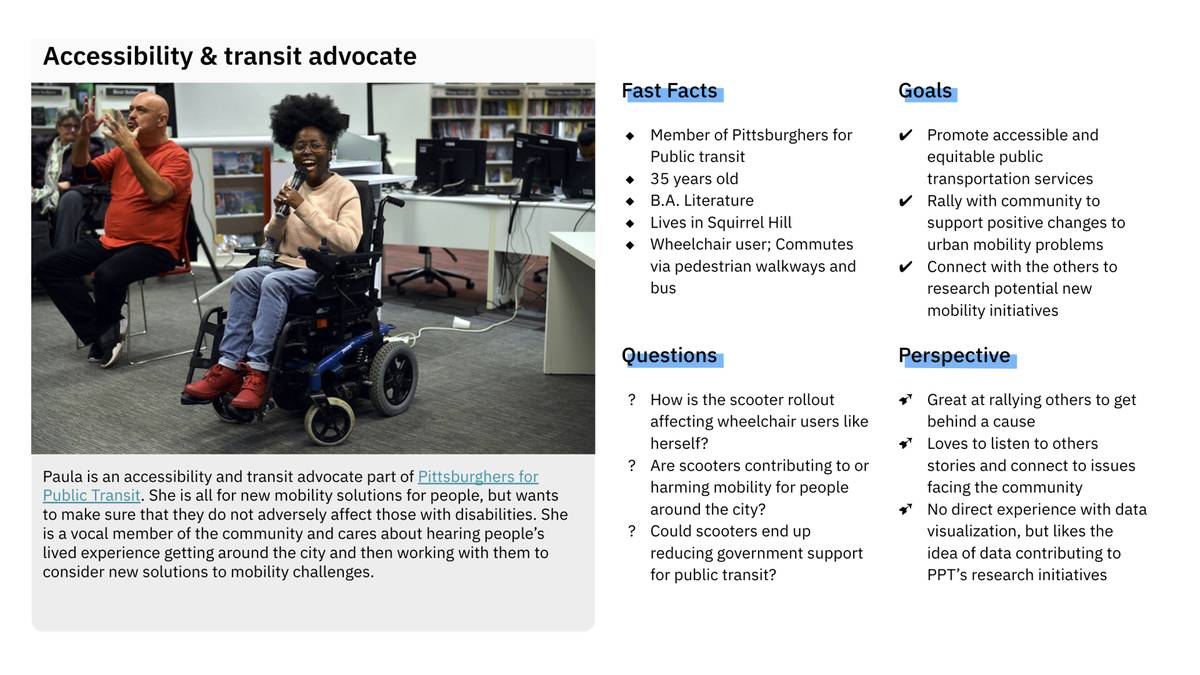
During the three-week class project, we are designing for two specific groups of users for our client SPIN, the e-scooter company. Given the persona fabricated by prior researchers, our goal is to address their known problems and fulfill respective goals within one coherent multi-user interface design.
Designing for Gig Workers
→ To Relocate E-Scooters Efficiently as a Part-Time Job
Map View
To help gig workers optimize their time collecting e-scooters around the city, our design automatically recommends an optimized route with respect to the worker's desired working time.
However, we understand no automation is perfect. Gig workers can also rely on the real-time heatmap data to base their decision. At the same time, we envision the recommendation algorithm will benefit from the custom route that experienced workers deem more fruitful than the automated route.
Insight Widgets
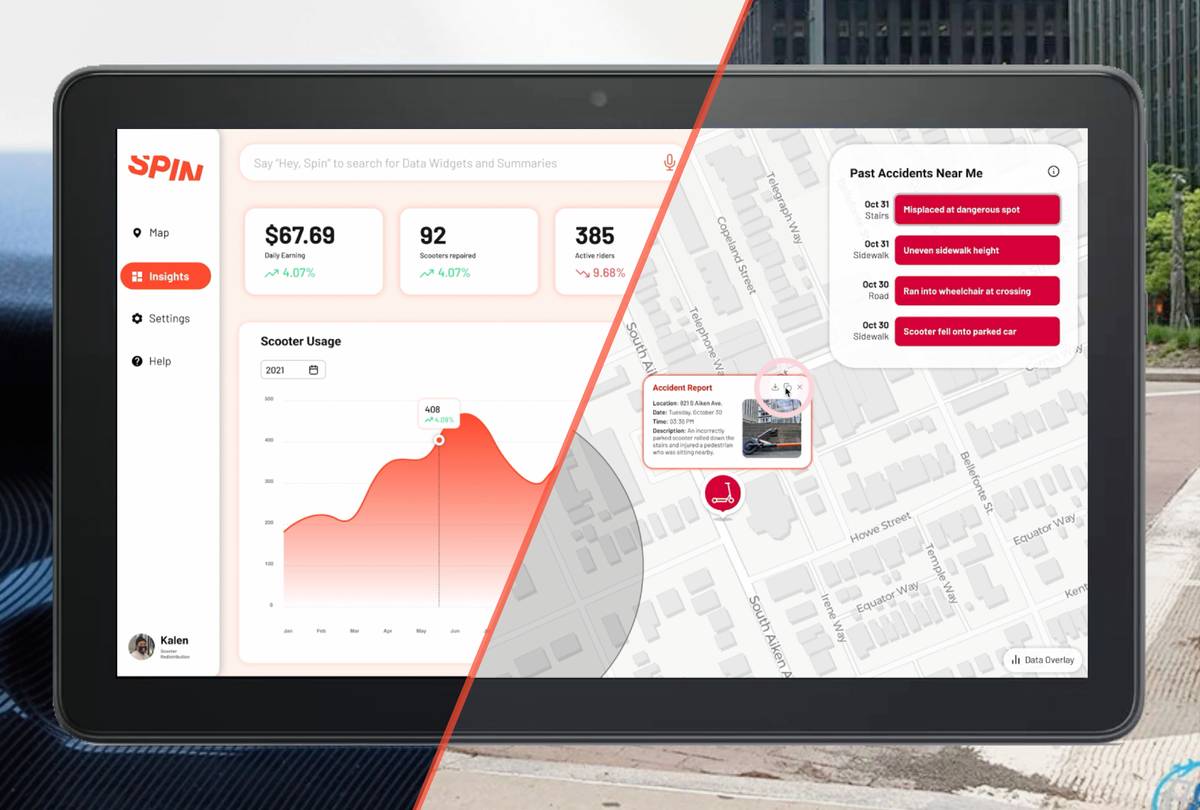
The insight panel is great for identifying patterns. For example, gig workers can review their earnings, performance, and summary of past data, such as traffic, to consolidate their decision-making. The widget-based panel allows for maximum customization.
Working in and out of a vehicle, gig workers benefit from the voice command interface to quickly pinpoint specific data, such as the scooter usage yesterday in a nearby neighborhood. After the query, the worker can also choose to pin it as a permanent widget or save the summary to the device.
Designing for Accessibility Advocates
→ To Understand the Accessibility Impact of E-Scooter Rollout
Map View
The dashboard map leverage real-time location of each individual scooter around the user to help advocates identify problems, such as scooter speeding, invasion of sidewalks, and incorrect parking in prohibited areas.
In addition, the map displays reported accidents from the past with location proximity. This allows advocates to identify and investigate the physical site of accidents to advise urban planning and construction.
Insight Widgets
Similarly, advocates can pin useful information widgets on the insight panel. By comparing trends of scooter accidents and mislocated vehicles and gathering qualitative community feedback, accessibility advocates will be able to scrutinize the impact of the electric scooter rollout.
Design Research
→ Data Analysis and Interaction Modeling
Real-Life Data
Our team utilized the scooter data available to gain insights through data visualization using Tableau.
We learned from our data analysis that the flow of scooters has significant spatial and temporal patterns. These could be critical insights to provide users with an intuitive dashboard interface.
Identifying Players & Goals
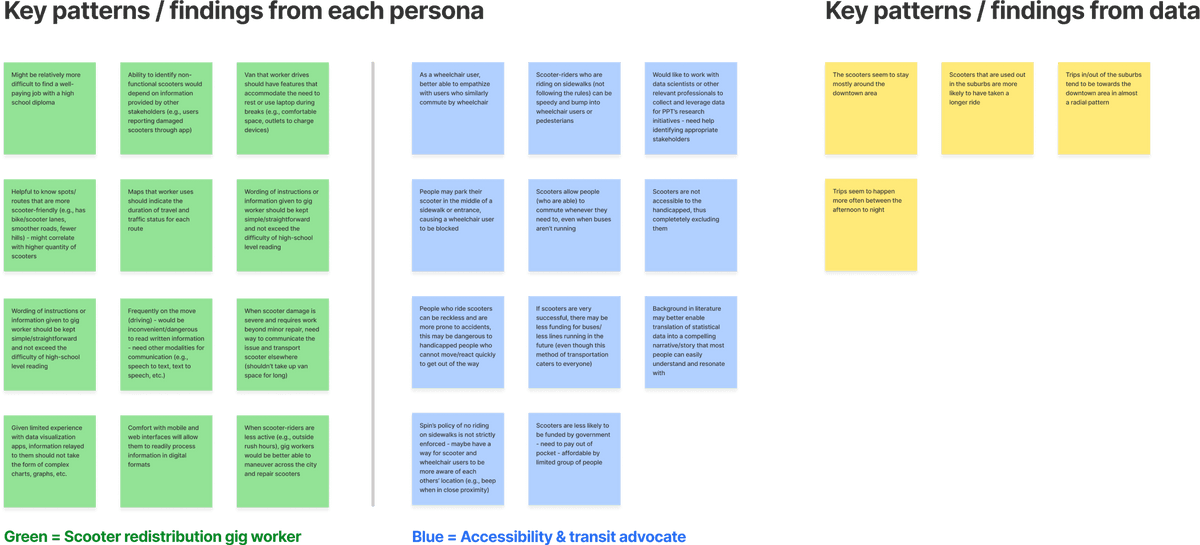
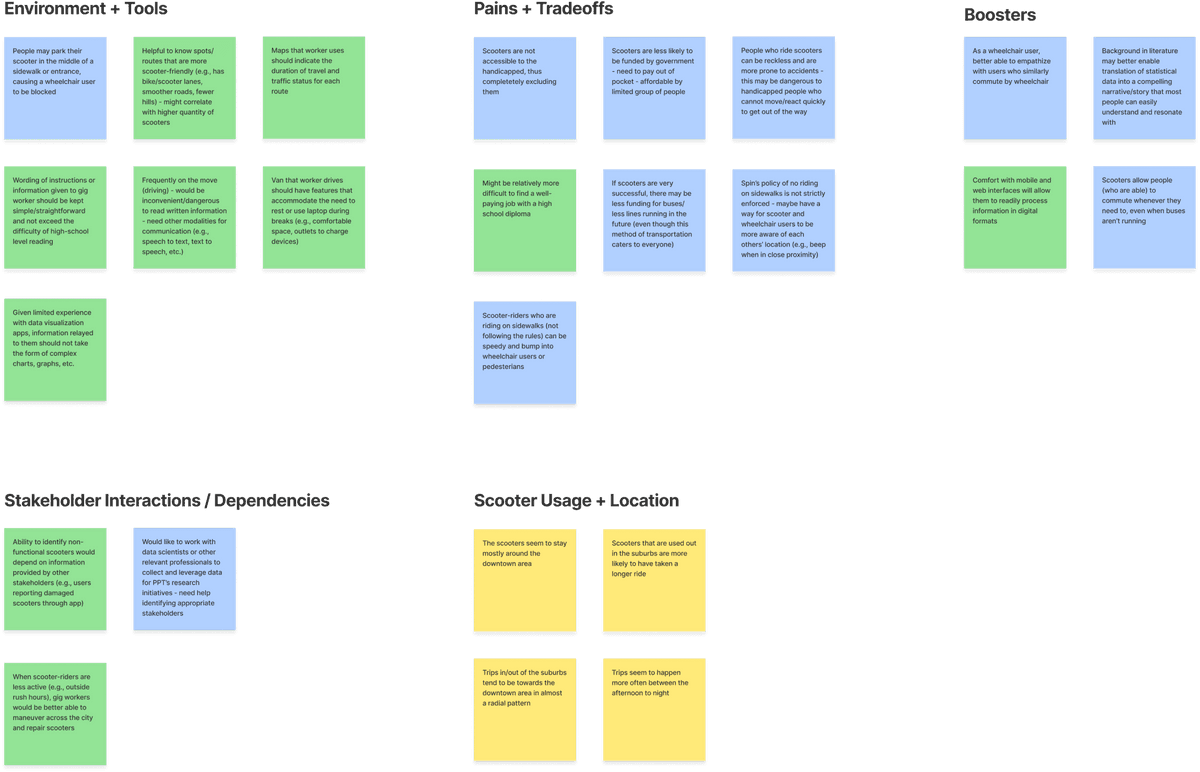
After understanding our two personas' perspectives, needs, and goals, we used an Affinity Diagram to organize our analysis of the various personas and identify insights.
By visualizing the data, we could understand how each persona can benefit from knowing specific data insights and how overlap could be across even relatively opposite personas.
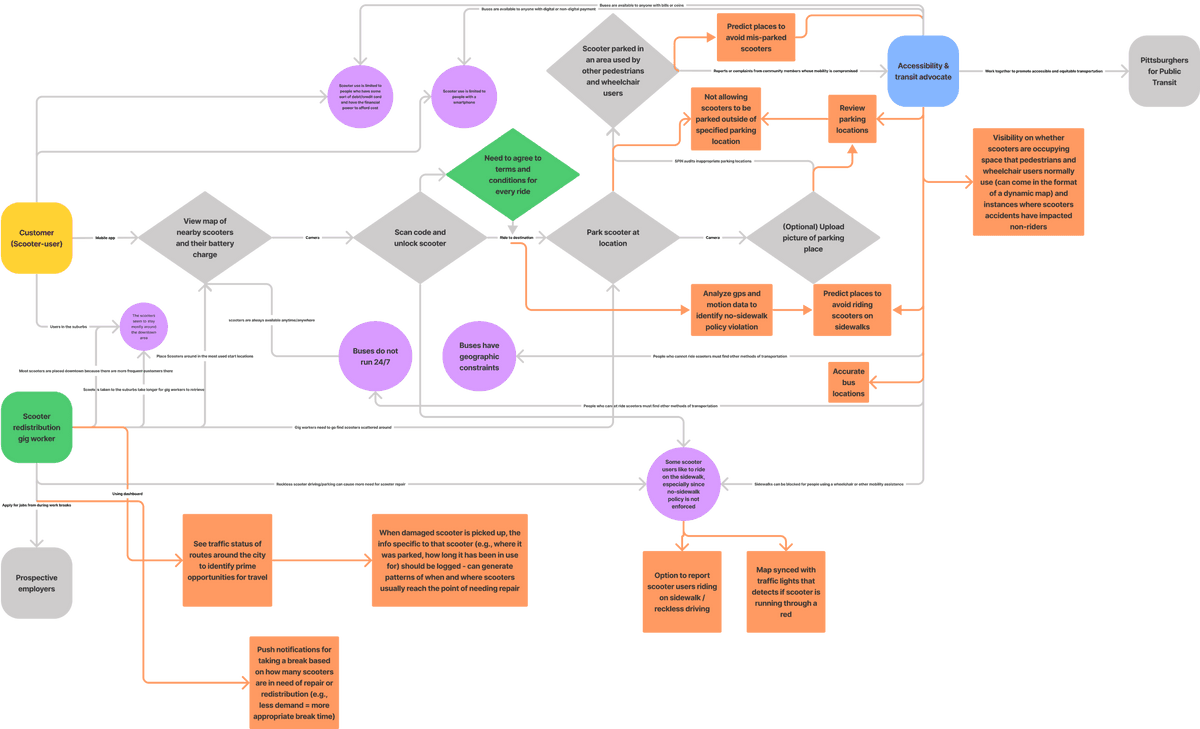
Modeling Current State
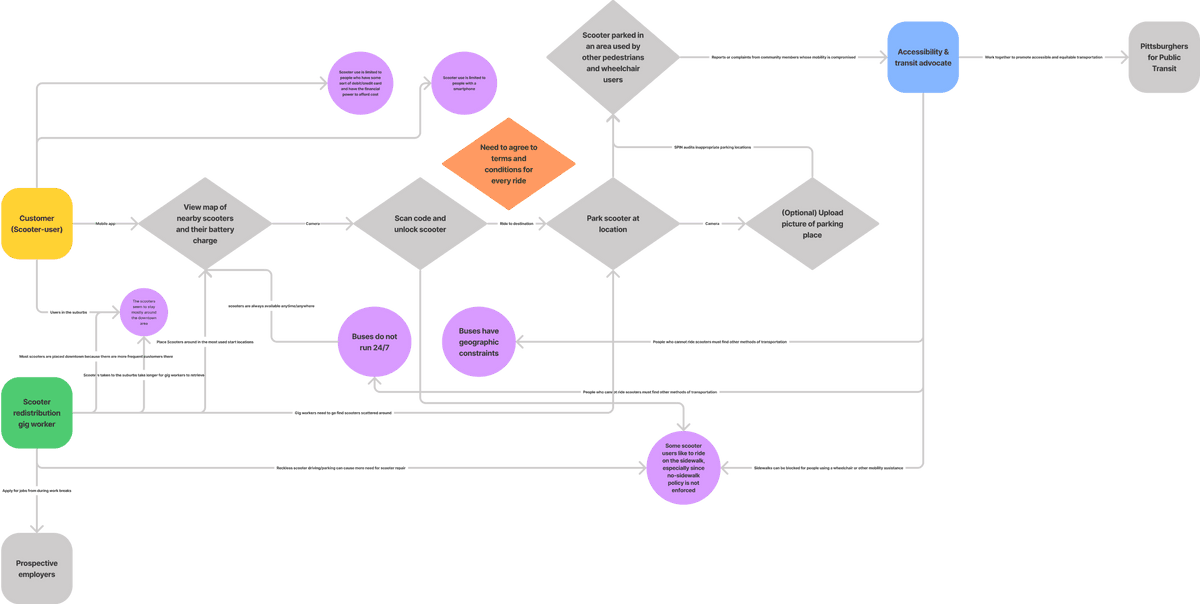
We modeled the current state, highlighting interactions between the personas and their environment along with the SPIN scooters and their users. Significant pain points ranged from scooters parked on the sidewalk hindering wheelchair users from passing safely to difficulties locating broken scooters, which causes more accidents.
Imagining Desired State
With the information gathered from the current state model, we added interception points to the model where we anticipate our dashboard to facilitate the personas. Examples include providing gig workers with a map that calculates the best routes to get to multiple scooter locations and data for advocates that lets her know if a scooter is parked on the sidewalk near her in real time.
